
The 2026 Winter Paralympics will bring together some of the world’s most inspiring athletes, competing across snow and ice events in northern Italy. If you’re wondering what channel is the 2026 Paralympics on in the UK, the simple answer is Channel 4. The broadcaster will deliver extensive free-to-air coverage throughout the Games, ensuring UK viewers can follow every key moment. Channel 4 will provide more than 60 hours of live coverage, alongside highlights and digital streaming options. Fans can watch the action across multiple platforms, making it easy to follow the Games whether at home or on the go. Key broadcast details include: Main UK broadcaster: Channel 4 Live coverage: Over 60 hours during the Games Streaming: Channel 4 Streaming platform Online coverage: Channel 4 Sport YouTube channel Event dates: 6 March – 15 March 2026 With daily live coverage, highlights programmes, and accessible viewing options, the Milano-Cortina 2026 Winter Paralympics will be widely available for audiences across the UK. What Are the 2026 Winter Paralympics and Why Are They Significant? The Winter Paralympics is one of the most prestigious global sporting events for athletes with disabilities. Held every four years shortly after the Winter Olympics, the Games bring together elite competitors from around the world to compete in high-level winter sports. The event celebrates athletic excellence, resilience, and the spirit of inclusive sport. The 2026 Winter Paralympics, taking place in Milano-Cortina, will feature around 700 athletes competing for medals across several disciplines. The Games highlight both competitive achievement and the broader impact of sport in promoting accessibility and opportunity. Key highlights of the 2026 Winter Paralympics include: Around 700 international athletes participating 79 medal events across six winter sports Strong representation from ParalympicsGB athletes Global audiences watching inspiring performances For UK viewers, the Games provide an opportunity to support Team GB while witnessing inspiring stories of determination and world-class sporting achievement. When and Where Will the 2026 Winter Paralympics Take Place? The Milano Cortina 2026 Winter Paralympics will take place in Italy from 6 March to 15 March 2026, bringing together athletes, coaches, and spectators for around ten days of exciting winter sports competition. Events will be hosted across several venues in northern Italy, with Milan and Cortina d’Ampezzo serving as the main host cities. This multi-location approach allows organisers to utilise specialised venues for different sports. Alpine resorts in the Italian mountains will host snow events such as skiing and snowboarding, while indoor arenas will stage ice sports like para ice hockey and wheelchair curling. Event Detail Information Host Country Italy Main Host Cities Milan and Cortina d’Ampezzo Opening Ceremony 6 March 2026 Closing Ceremony 15 March 2026 Duration Approximately 10 days Overall, the Italian alpine setting will provide a spectacular backdrop for athletes and fans as the world gathers to celebrate the 2026 Winter Paralympic Games. What Channel is the 2026 Paralympics On in the UK? For viewers in the United Kingdom, Channel 4 is the official broadcaster of the 2026 Winter Paralympics. The channel has secured the UK television rights and will deliver extensive coverage throughout the duration of the Games. Channel 4 plans to broadcast more than 60 hours of live sporting action, allowing audiences to follow a wide range of events across the competition schedule. This includes coverage of key medal events, daily competitions, and major moments such as the opening and closing ceremonies. Over the years, Channel 4 has played a significant role in raising the profile of Paralympic sport in the UK through engaging broadcasts and expert commentary. For the 2026 Games, viewers can expect daily live coverage and evening highlights summarising the most important moments. Importantly, Channel 4’s coverage will be free-to-air, meaning viewers can watch the Paralympics without paying for a subscription or premium sports package. How Can You Watch the 2026 Winter Paralympics Live in the UK? UK viewers have several convenient ways to watch the 2026 Winter Paralympics live, whether through traditional television broadcasts or modern streaming platforms. Channel 4 will provide extensive coverage of the Games, ensuring audiences can follow the action from home or on the go. Watching on TV Watching the Paralympics on traditional television remains one of the easiest ways for UK audiences to follow the event. Channel 4 will broadcast daily coverage of the Winter Paralympics, ensuring viewers can watch major events live as they happen. Television coverage will include: Live sporting competitions across multiple disciplines The official opening ceremony of the Games Daily highlight programmes summarising the action The closing ceremony marking the end of the Paralympics This broadcast schedule allows viewers to follow the most important moments throughout the competition. Streaming Online In addition to television broadcasts, viewers will also be able to stream the Paralympics online through several digital platforms. Streaming options are ideal for those who prefer watching content on mobile devices or computers. Online viewing options include: Channel 4 Streaming, which simulcasts the television broadcast online Channel 4 Sport’s YouTube channel, offering additional coverage and highlights Live streaming for viewers who want to watch on smartphones or tablets These platforms ensure that viewers can access Paralympic coverage wherever they are, making it easier to follow the Games throughout the day. What is the Daily TV Schedule for the 2026 Winter Paralympics? Channel 4’s coverage will run throughout the Games, starting with the opening ceremony and continuing with daily live broadcasts of competitions. Each day will feature several hours of live sport, typically beginning early in the morning and running into the afternoon. Alongside the live events, the broadcaster will also provide an evening highlights programme that summarises the most important moments of the day. The table below outlines the main coverage schedule for UK viewers: Date Coverage UK Time Platform 6 March Opening Ceremony 6:30pm – 9:00pm Channel 4, Streaming 7–8 March Live Coverage 8:00am – 1:00pm Channel 4 9–11 March Live Coverage 8:00am – 3:40pm Channel 4 12 March Live Coverage 8:00am – 1:35pm Channel 4 13 March Live Coverage 8:00am – 2:30pm Channel 4 14
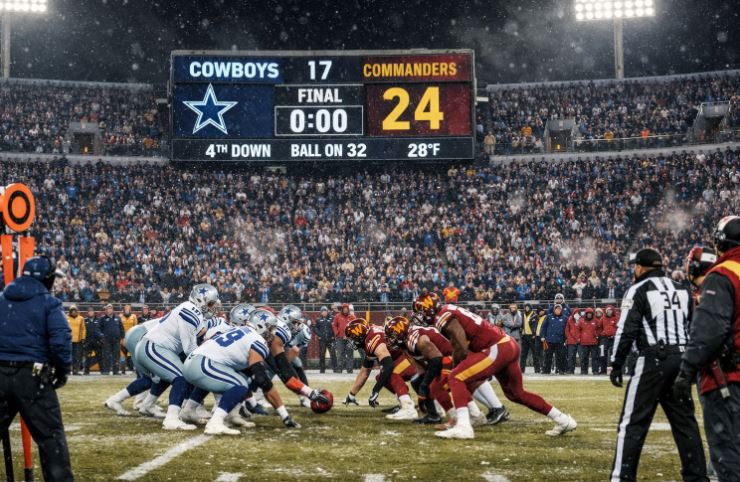
Washington Commanders vs Dallas Cowboys Match Player Stats
The Washington Commanders vs Dallas Cowboys match player stats from the Christmas Day 2025 NFL clash tell a detailed story of control, discipline, and timely execution. Played at Northwest Stadium in Landover, Maryland, this matchup brought together two teams at different stages of their season journeys. Dallas entered the game with a 7 8 1 overall record and a 3 5 away record, while Washington came in at 4 12 with struggles at home reflected in a 2 6 record. From the opening drive, the contest showed signs of being shaped by possession, efficiency, and individual brilliance rather than turnovers or chaotic moments. The Cowboys eventually secured a 30 23 victory, but the scoreline only partially explains how the game unfolded. A closer look at the quarter by quarter progression, individual performances, and team statistics highlights why Dallas controlled the tempo and how Washington showed flashes of promise despite the loss. This detailed breakdown focuses on how the game developed, who stood out, and what the numbers reveal when analysed carefully. Every insight is drawn from the official box score, match reports, and leading sports coverage from trusted sources, ensuring accuracy and relevance for the 2025 NFL season. How Did the Game Unfold Quarter by Quarter? The flow of the game clearly reflected Dallas’ ability to sustain drives and manage the clock, while Washington relied more on explosive moments rather than extended possessions. Each quarter contributed to the overall narrative of control versus efficiency. First Quarter Momentum Dallas set the tone early with a touchdown drive that lasted 13 plays and covered 78 yards in just over five minutes. This opening possession immediately showed the Cowboys’ intention to dominate time of possession. Washington responded positively with an eight play field goal drive, trimming the score to 7 3, but the early balance already leaned towards Dallas. Second Quarter Control The second quarter proved decisive. Dallas opened with another methodical touchdown drive of 17 plays, followed by a rapid scoring drive covering 97 yards in just over two minutes. Washington briefly responded with a touchdown drive of their own, but Dallas closed the half with a field goal, taking a 24 10 lead into the break. The Cowboys’ ability to mix long drives with quick strikes created separation on the scoreboard. Second Half Response Washington commanders showed resilience after halftime. A 72 yard touchdown play early in the third quarter reignited the home crowd, followed by a sustained field goal drive that narrowed the gap to 27 20. However, Dallas consistently answered with points, ensuring the Commanders never fully seized momentum. Final Quarter Execution The fourth quarter highlighted Dallas’ composure. Despite a missed field goal, the Cowboys burned significant clock on a 14 play drive before extending their lead to 30 20. Washington added a late field goal, but Dallas closed the game with a controlled final possession to seal the 30 23 result. Who Were the Offensive Standouts in the Match? Individual performances shaped the Washington Commanders vs Dallas Cowboys match player stats narrative, particularly on offense where Dallas showcased balance and Washington relied on select playmakers. Dallas Cowboys Offensive Leaders Dak Prescott delivered a composed performance, throwing for 307 yards on 19 completions from 37 attempts and registering two passing touchdowns. His decision making stood out, especially with zero interceptions against a defensive front that applied pressure. The Cowboys’ ground game was led by Malik Davis, who recorded 103 rushing yards on 20 carries. His consistency allowed Dallas to control tempo and keep Washington’s defence on the field. KaVontae Turpin added a spark with 86 receiving yards and a touchdown from a single catch, highlighting Dallas’ ability to generate explosive plays. Washington Commanders Key Contributors Josh Johnson provided stability at quarterback, completing 15 of 23 passes for 198 yards without turnovers. While he did not throw a touchdown, his efficiency kept Washington competitive. Jacory Croskey Merritt emerged as a standout with 105 rushing yards on 11 carries and two rushing touchdowns, accounting for the Commanders’ most impactful scoring plays. Deebo Samuel contributed in the receiving game with 68 yards on two receptions, showing his big play potential even with limited targets. What Do the Defensive Stats Reveal About the Matchup? Defensive numbers from this game underline the importance of pressure and tackling efficiency rather than takeaways, as neither team committed a turnover. Dallas Defensive Impact Dallas generated six sacks for a total loss of 38 yards, consistently disrupting Washington’s offensive rhythm. Jadeveon Clowney led the pass rush with 1.5 sacks, applying pressure at crucial moments. Linebacker Shemar James contributed six total tackles, three of which were solo efforts, helping limit Washington on third down situations. Washington Defensive Highlights Washington’s defensive front found success through JerZhan Newton, who recorded three sacks and was a constant presence in the interior. Bobby Wagner anchored the defence with ten total tackles, five solo, showcasing leadership and experience in containing Dallas’ short passing game. Despite these efforts, extended drives by Dallas wore down the Commanders’ defence over time, particularly late in each half. How Did the Team Stats Compare Overall? Team statistics provide a clear explanation for the final score and illustrate how Dallas maintained control throughout the contest. Team Comparison Category Dallas Cowboys Washington Commanders Total Yards 480 328 First Downs 28 17 Time of Possession 38:44 21:16 Third Down Efficiency 8 of 20 1 of 6 Fourth Down Efficiency 6 of 6 0 of 0 Penalties 11 for 89 yards 10 for 71 yards Turnovers 0 0 Dallas ran 87 total plays compared to Washington’s 41, highlighting a significant disparity in offensive opportunity. The Cowboys’ dominance on fourth down conversions further extended drives and exhausted the Commanders’ defence. Who Dominated the Air and Ground Game? The balance between passing and rushing was a defining factor in the Washington Commanders vs Dallas Cowboys match player stats. Passing Game Comparison Dallas accumulated 269 passing yards with an average of 6.3 yards per pass attempt. Washington recorded 190 passing yards with a higher average

How Sports Timelines Help Fans, Analysts, and Businesses Understand Modern Sport?
Sport has always been about moments. A last-minute goal, a dramatic collapse, a historic rivalry or a record-breaking performance can define an era. In today’s digital age, these moments are no longer remembered only through memory or highlight reels. They are carefully organised into timelines that help fans and analysts follow the story of sport as it unfolds. Sports timelines provide structure, context, and clarity, allowing readers to understand how teams evolve, how rivalries grow, and how individual performances shape long-term outcomes. Across football, cricket, and global leagues, timelines have become one of the most effective ways to present sports information. They combine historical depth with modern analysis, helping readers make sense of both past achievements and current form. This approach has transformed how sports content is consumed, moving beyond isolated match reports to broader narratives that reflect the true journey of a team or competition. The Growing Importance of Sports Timelines in Modern Coverage Sports fans no longer follow just individual matches. They track seasons, tournaments, and player careers over time, and timelines make this easier by presenting events in a clear, logical order. A football rivalry becomes more meaningful when fans can see how results shift, tactics evolve, and key fixtures shape title races. In cricket, timelines are particularly valuable for understanding long series and tournaments. They simplify complex formats by highlighting turning points, form changes, and milestone performances. This structured storytelling also boosts engagement, encouraging readers to follow a complete narrative rather than jumping between disconnected articles, reflecting a growing demand for context and continuity in modern sports journalism. Understanding Football and Cricket Through Historical Context Football and cricket dominate sports conversations in the UK and beyond, and timelines play a key role in shaping how these sports are understood. In football league positions rarely tell the full story on their own. A timeline can reveal whether a team’s rise is the result of consistent improvement or a short-term surge. It can highlight periods of dominance, sudden declines, or tactical revolutions that changed the direction of a club. Cricket timelines add similar depth. They help fans track how teams perform across different venues, formats, and conditions. By laying out results chronologically, readers can identify patterns that might otherwise be missed, such as how a side performs under pressure or how a particular opponent has historically posed challenges. This historical perspective is essential for modern sports fans. It allows them to appreciate achievements in context rather than viewing them as isolated events. Timelines also make sports more accessible to newer audiences, who may not have followed a team or competition for years but still want to understand its background. Sports Timelines as a Tool for Insight Beyond the Pitch While timelines are primarily designed for fans and analysts, their value increasingly extends beyond traditional sports audiences. As sport becomes more commercial and data-driven, structured historical information plays a role in broader decision-making. Media organisations, sponsors, and sports-related businesses rely on performance trends, audience engagement patterns, and long-term narratives to guide strategy. Business-focused platforms such as www.ukbusinesstimes.co.uk often explore how data, analytics, and long-term performance trends influence industries, including sport. When sporting outcomes are placed within clear timelines, they offer insight into growth cycles, brand value, and the commercial impact of sustained success or decline. Why Timelines Improve Sports Analysis and Predictions? Another reason timelines have gained popularity is their usefulness in analysis and prediction. Analysts often rely on historical performance to assess future outcomes, whether that involves league fixtures, tournament progress, or individual player form. Timelines make this information easier to interpret by presenting it in a continuous sequence rather than fragmented data points. For fans interested in predictions or fantasy sports, timelines provide essential context. They show how teams respond after losses, how players perform against specific opponents, and how form changes over time. This deeper understanding leads to more informed opinions and a greater appreciation of the tactical and psychological elements of sport. Timelines also reduce information overload. Instead of sifting through dozens of articles, readers can follow a single, well-structured overview that captures the most important developments. This clarity is one of the reasons timeline-based sports content continues to grow in popularity. The Future of Sports Storytelling Through Timelines As sports coverage continues to evolve, timelines are likely to become even more central to how stories are told. Fans increasingly expect content that is not only fast but also meaningful. Timelines meet this demand by combining immediacy with depth, allowing readers to stay updated while still understanding the broader narrative. With more competitions, more data, and more global audiences than ever before, structured storytelling is essential. Timelines provide a format that can adapt to different sports, regions, and levels of competition while maintaining clarity and relevance. They transform raw results into stories that reflect the true journey of teams and athletes. Conclusion Sports timelines have reshaped how fans experience football, cricket, and global competitions. By organising moments into clear narratives, they provide context, improve analysis, and deepen engagement. Whether tracking historic rivalries or understanding modern form, timelines help readers see sport as an ongoing story rather than a series of disconnected events. As sports content continues to grow in complexity, timeline-driven coverage will remain one of the most effective ways to make sense of the action on and off the pitch.
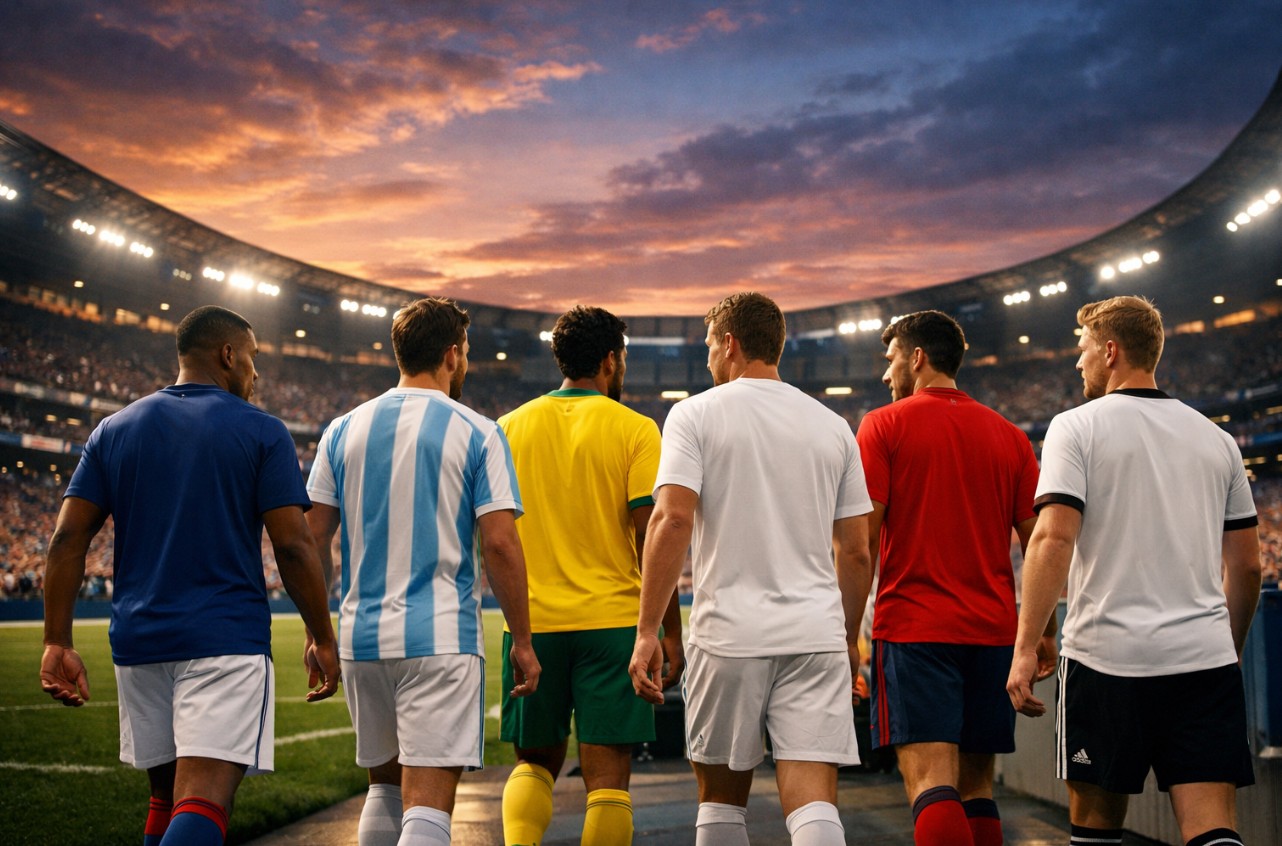
World Cup 2026 Teams and Star Players Tipped to Shine
The 2026 FIFA World Cup promises to be unlike any before it. Hosted across the US, Canada and Mexico, the expanded 48-team format brings more matches and greater emphasis on squad depth. With an additional knockout round added to the competition, it means teams will have to utilise their squads and rely on players to change games when it matters the most. The Teams and Star Names Ready to Deliver at the World Cup France France remain one of the most complete sides in international football. Their strength lies in their flexibility as they can dominate possession, defend compactly or hit teams on the break. Kylian Mbappe remains their central figure, with his pace and precision making him a threat for any opposition. Around him is a squad packed with experience, athleticism and technical quality, so it’s easy to see why World Cup betting odds indicate France have a great chance of going all the way. Argentina Argentina’s recent success has been built on control rather than chaos. They head to North America as the defending champions, and as well as having the know-how, they also know how to slow games down, protect leads, and strike at the right moment. Lionel Messi may not play every minute, but his influence alone will be enough to inspire Argentina. Around Messi is a group of players who understand their roles, including industrious midfielders and mobile forwards who press intelligently. Brazil Brazil arrive at every World Cup with expectations, and 2026 will be no different. Their strength is still found in attacking areas, particularly out wide, where pace and flair stretch defences. Vinicius Junior brings unpredictability, capable of turning half-chances into goals. If Brazil can strike the right balance between defensive structure and attacking freedom, they can rival any team in the tournament. Having Carlos Ancelotti as manager is a big boost, too. England Like Brazil, England also head into tournaments expected to challenge. And in recent years, the Three Lions have improved on the world stage. At the 2026 World Cup, Thomas Tuchel will be looking to get the best out of his team and give them that final 5% to get over the line. He can call on the likes of Declan Rice, Phil Foden and Harry Kane, world-class players, to move England towards achieving their target of winning a World Cup for the first time since 1966. Spain and Germany Spain remain the masters of control, with a possession-based approach designed to exhaust opponents and create openings through movement and precision. Predri dictates tempo, while the likes of Yamine Lamal create havoc out wide for the current European champions. Germany, meanwhile, are rediscovering their identity through dynamic midfield play and interchanges around the box. Jamal Musiala is their key to success. What both teams have in common is that they’re built for tournament football. Conclusion World Cup success is rarely accidental. Teams that thrive are those with tactical clarity, mental resilience and players capable of delivering in decisive moments. France, Argentina, Brazil, England, Spain and Germany all possess those qualities heading into the tournament. With expanded squads and added knockout rounds, the spotlight will shine brighter on stars who can turn opportunity into history when it matters most. And these nations, plus several others, have these types of megastars who can really make the difference in the biggest games of all.
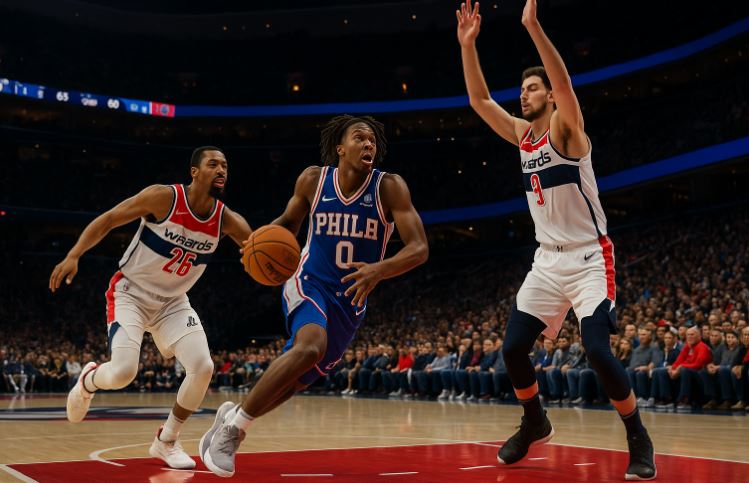
76ers vs Washington Wizards Match Player Stats
Watching the Philadelphia 76ers clash with the Washington Wizards on December 2nd, 2025, felt like witnessing a masterclass in momentum basketball. As someone who follows the NBA closely, Tyrese Maxey’s explosive third-quarter performance stood out brilliantly. From start to finish, the game showcased moments of grit, pace, and individual brilliance. This breakdown dives into the full player stats, key plays, and turning points that defined this matchup at Xfinity Mobile Arena in Philadelphia. Let’s explore how it all unfolded. How Did Tyrese Maxey Dominate the Game for the 76ers? There are performances in the NBA that define not just a player’s form but also the rhythm of the entire team. Tyrese Maxey’s outing against the Washington Wizards was one such performance. Playing just under 29 minutes, Maxey exploded for 35 points on 13 of 26 shooting, including four successful three-pointers. What made his night special wasn’t just the volume of points but the timing, 20 of those came in a single third quarter blitz that completely shifted the momentum in favour of the 76ers. Maxey had already shown signs of brilliance in previous games, but this match was a testimony to his leadership and precision under pressure. With his speed and confidence in pulling up from deep, Maxey opened up the floor for his teammates. His 100% accuracy from the free-throw line was another indicator of his efficiency. Key Stats for Tyrese Maxey Minutes Played: 28:49 Field Goals: 13-26 (50%) 3-Point Shooting: 4-9 (44.4%) Free Throws: 5-5 (100%) Assists: 6 Steals: 4 Blocks: 1 His performance wasn’t just about points. Maxey’s playmaking added value throughout the game, with six assists that created momentum-shifting buckets. What Sparked the Third Quarter Surge for Philadelphia? The 76ers entered the third quarter with a 12-point lead, but the Wizards managed to cut that down to five early on. What followed was a stunning response led by Maxey. The 76ers went on an 11-2 run, pushing the lead back to double digits and essentially taking the air out of the Wizards’ momentum. Maxey scored 20 of his total 35 points in this period, while the Wizards managed only 23 points in the entire quarter. Washington shot just 7 of 22 in that stretch, missing critical opportunities to close the gap. Factors That Sparked the Surge Maxey’s quick transition play Efficient perimeter shooting from players like Jared McCain and Justin Edwards Strong defensive rebounding and outlet passes from Andre Drummond This third-quarter dominance showcased the 76ers’ ability to capitalise on runs and seal games with tempo and energy. 76ers vs Washington Wizards Match Player Stats The final scoreline read 121-102 in favour of the 76ers, and the player statistics reflect how dominant Philadelphia were throughout the game. Team Shooting Comparison Team FG% 3P% FT% Rebounds Assists Points 76ers 45.1 42.5 70.6 51 26 121 Wizards 39.8 25.0 71.9 53 23 102 The Wizards managed more total rebounds but were inefficient in scoring, particularly from three-point range. In contrast, Philadelphia’s bench provided reliable support, extending the lead in the absence of starters in the final quarter. Who Were the Top Scorers for the Wizards? Despite the loss, the Wizards had seven players score in double figures, showing their attempt at spreading the offensive responsibility. Tristan Vukcevic led the team with 16 points in just under 22 minutes, showing solid efficiency with a field goal percentage of 66.7%. Marvin Bagley III, Justin Champagnie, and Will Riley also contributed with 13 points each. However, most of these came in moments when the game was slipping away, lacking the impact to shift momentum. Standout Performers Tristan Vukcevic: 16 pts, 6-9 FG Marvin Bagley III: 13 pts, 100% from the free-throw line Justin Champagnie: 13 pts, 7 rebounds Will Riley: 13 pts, 83.3% FG The efforts were there, but none of the Wizards’ stars could match the intensity Maxey brought during that crucial third quarter. How Did Bench Players Impact the Outcome? Philadelphia’s bench unit played a decisive role in preserving and extending the lead when the starters rested. Jared McCain was particularly effective, scoring 14 points with a shooting efficiency of 54.5%. Jabari Walker also delivered a strong two-way performance with 10 points and 12 rebounds. The 76ers bench outscored the Wizards’ reserves and helped maintain defensive pressure throughout. Key Bench Contributions Jared McCain: 14 points, 5 assists Jabari Walker: 10 points, 12 rebounds Adem Bona: Perfect from the field and free-throw line This bench depth allowed coach rotations without compromising game flow. What Were the Key Shooting and Rebounding Stats? The shooting efficiency was one of the biggest differences between the teams. While the 76ers shot 45.1% from the field and an impressive 42.5% from beyond the arc, the Wizards struggled, shooting under 40% from the field and just 25% from deep. Shooting and Rebounding Summary Team FG Made 3P Made Total Rebounds Philadelphia 46 17 51 Washington 35 9 53 Philadelphia had a slight edge in defensive rebounds, which led to quick transition plays and fast break points. Drummond’s 10 rebounds, along with Walker’s 12, solidified their presence in the paint. 76ers vs Washington Wizards Match Player Stats – Team Performance Breakdown The 76ers’ team performance was built around quick ball movement, outside shooting, and stifling defence in the second half. The Wizards, on the other hand, showed promise early on but faded due to poor shot selection and weak defence on perimeter plays. Breakdown by Quarters Quarter 76ers Wizards Q1 34 27 Q2 32 27 Q3 34 23 Q4 21 25 Philadelphia won three out of four quarters decisively. The third quarter was the game-changing period, dominated entirely by the hosts. What Role Did Maxey’s Consistency Play in the 76ers’ Win? Maxey has been on a consistent scoring streak, and this match was no exception. Scoring 20+ points in 20 straight games shows not only reliability but leadership. Even when he’s not on the floor, his energy sets the tone for the rest of the squad. His ability to score from the perimeter, attack the rim,
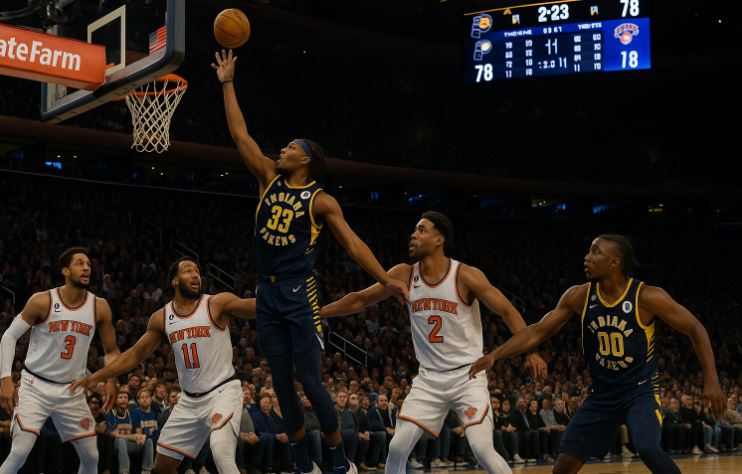
Pacers vs Knicks Match Player Stats | Who Dominated the Court?
Every now and then, a basketball match comes along that doesn’t just entertain, it captivates. Game 1 of the 2025 Eastern Conference Finals between the Indiana Pacers and the New York Knicks was exactly that. As fans across the UK tuned in during the early hours, they witnessed one of the most dramatic postseason clashes in recent memory. Played at the iconic Madison Square Garden, the matchup brought together two well-balanced teams and two superstar performances. The Pacers scraped a thrilling 138-135 overtime win, thanks to Tyrese Haliburton’s game-tying jumper and outstanding composure during clutch moments. For the Knicks, Jalen Brunson poured in a jaw-dropping 43 points, yet even that wasn’t enough to carry them over the line. This blog dives deep into the stats, player performances, and the subtle factors that tilted the game in Indiana’s favour. How Did Tyrese Haliburton’s Game-Winning Performance Impact the Pacers? Tyrese Haliburton’s leadership and execution in Game 1 were nothing short of elite. He wasn’t just scoring, he was orchestrating every possession with composure and intelligence. With 31 points, 12-of-23 shooting from the field, and 7 assists, he played like a veteran well beyond his years. Key Highlights from Haliburton Drained a buzzer-beating jumper to force overtime Controlled the pace with calm decision-making Shot 3-of-4 from the free-throw line Involved in critical assists late in the 4th and OT When the Pacers needed a steady hand, Haliburton delivered. Even after missing a few deep threes late in regulation, he remained confident. His balanced blend of scoring and playmaking gave the Pacers structure in chaos. Why It Mattered? The Knicks had built a 17-point lead at one stage. But Haliburton kept the Pacers poised. His ability to find shooters in rhythm (notably Aaron Nesmith and Myles Turner) chipped away at the deficit. In overtime, it was Haliburton again who steadied the ship. While the Knicks struggled to protect the ball, Haliburton drove into the paint, creating space or kicking out. His shot selection, mostly mid-range and floaters, was critical in keeping the scoreboard ticking. What Made Jalen Brunson the Top Scorer Despite the Loss? Jalen Brunson’s offensive explosion was nothing less than heroic. He scored 43 points on 15-of-25 shooting, including 12-of-14 from the free-throw line. Every time the Pacers closed the gap, Brunson came back with a fadeaway, floater, or a tough layup through traffic. He wasn’t just shooting, he was creating. His footwork in the paint often left defenders guessing, and his control in tight spaces gave him several easy looks. By the time the game reached overtime, Brunson had already crossed the 40-point mark. Key Areas of Dominance Outstanding in isolation sets Relentless in attacking switches Created second-chance plays through smart drives Found teammates like Robinson and Towns with perfect timing What makes Brunson’s stat line even more impressive is that he did it against a Pacers defence that often doubled him or forced him to go left. Despite all this pressure, he maintained a high field goal percentage and kept his team in the game. Who Had the Edge in the Paint – Pacers or Knicks? The battle inside the paint was one of the most fascinating subplots of the night. On paper, the Knicks had the edge with 62 points in the paint compared to the Pacers’ 50. Yet, the outcome told a more layered story. Interior Breakdown Stat Indiana Pacers New York Knicks Points in the Paint 50 62 Offensive Rebounds 11 13 Blocks 3 8 Defensive Rebounds 28 33 Second-Chance Points Moderate High What Happened? The Knicks leveraged their size, particularly with Karl-Anthony Towns and Mitchell Robinson, who attacked the rim relentlessly. Robinson’s alley-oop dunks and put-backs added quick points. For Indiana, Myles Turner was key. Though slightly outmuscled, he timed his contests well and hit big mid-range shots to pull New York’s bigs out of the lane. Pacers vs Knicks Match Player Stats This matchup was a statistical masterpiece, both teams shot exactly 51% from the field, making it one of the rare playoff games with such efficient offence on both sides. Team Shooting Summary Category Pacers Knicks Field Goal % 51% 51% 3-Point % 41% 32% Free Throw % 75% 70% Turnovers 7 15 Total Rebounds 39 46 Assists 26 24 The three-point advantage played a crucial role for Indiana, with Nesmith, Nembhard, and Haliburton all connecting from deep during high-pressure moments. On the other hand, turnovers killed the Knicks. They had 15 total, many coming in the final quarter and overtime. These unforced errors led directly to transition buckets for Indiana. Why Was Turnover Differential a Game-Changer? Turnovers were the Achilles’ heel for the Knicks. Despite leading in rebounds and blocks, they gave away possession 15 times, more than double the Pacers’ 7 turnovers. How This Affected Momentum? Knicks lost 27 points off turnovers, compared to Indiana’s 4 Key errors by Towns and Hart in the final minutes of regulation McBride and Anunoby struggled under Indiana’s full-court press Transition defence was exposed multiple times due to live-ball giveaways This lapse allowed Indiana to stay within striking distance and take control during OT. Turnovers weren’t just stat-sheet fluff, they were decisive. Who Contributed the Most Off the Bench for Both Teams? The benches played a less flashy but equally vital role. Indiana’s depth showed more impact, especially in stretches where the starters rested or struggled. Pacers’ Key Bench Contributors T.J. McConnell: Energised the second unit with 9 points and lockdown defence Obi Toppin: Provided bursts of offence inside Thomas Bryant: Cleaned up missed shots and earned crucial trips to the line Knicks’ Key Bench Players Miles McBride: Hit some perimeter shots but struggled defensively Josh Hart: Played with hustle but committed crucial turnovers Cameron Payne: Shot inconsistently and couldn’t stretch the floor Indiana’s bench outscored and outperformed New York’s, helping to maintain intensity and pace throughout the game. How Did the Starters Compare in Minutes and Efficiency? The starters for both teams logged heavy minutes, especially in an overtime battle. However, efficiency varied greatly.
Colts vs Jacksonville Jaguars Match Player Stats
There’s something uniquely thrilling about the final week of the NFL regular season. The stakes are high, the players leave everything on the field, and the fans ride an emotional rollercoaster from the first whistle to the last. The Week 18 clash between the Indianapolis Colts and the Jacksonville Jaguars on January 5, 2025, was a perfect reflection of that intensity. Taking place at the electrifying Lucas Oil Stadium in front of over 63,000 fans, this game went into overtime and had just about everything, long touchdown runs, critical interceptions, and performances that defined careers. Whether you’re a stats junkie, a die-hard Colts or Jaguars fan, or just a casual UK-based NFL enthusiast exploring the league, this game offered something for everyone. Let’s break it down. How Did the Quarterbacks Perform Under Pressure? Quarterbacks are often judged by how they perform when the pressure is high, and this match didn’t disappoint in that regard. Joe Flacco, starting for the Colts, displayed composure and leadership, finishing the game with 264 passing yards. He completed 23 of 40 attempts, registering one touchdown and no interceptions, earning a quarterback rating of 85.8. It was a performance marked by smart throws, good pocket awareness, and the kind of veteran decision-making that has made him a dependable presence in recent seasons. On the other side, Mac Jones had a mixed outing for the Jaguars. While he managed 225 passing yards and one touchdown, he also threw a crucial interception that allowed the Colts to shift momentum. His rating stood at 80.9, respectable, but reflective of a few missed opportunities and tight defensive pressure from Indianapolis. Both quarterbacks had flashes of brilliance, but Flacco’s control in key moments and mistake-free football proved more influential in the final scoreline. Passing Comparison Quarterback Completions Attempts Yards Touchdowns Interceptions Rating Joe Flacco 23 40 264 1 0 85.8 Mac Jones 20 32 225 1 1 80.9 What Were the Most Impactful Plays of the Game? Certain moments from this game will be replayed for weeks. One of the highlights was Tank Bigsby’s explosive 65-yard touchdown run in the fourth quarter, shifting the momentum in favour of Jacksonville. Bigsby, known for his aggressive running style, found a gap on the left and sprinted down the sideline, leaving defenders in the dust. Alec Pierce also had a jaw-dropping moment when he hauled in a 65-yard touchdown pass from Flacco, tying the game late in the fourth quarter. That pass was thrown under pressure, making the connection even more impressive. Earlier in the game, a fumble recovery returned for a touchdown by Bigsby also served as a turning point. These standout moments brought the crowd to its feet and turned what seemed like a straightforward win into an overtime thriller. Each play reflected not just athletic excellence but strategic boldness by the coaching staff on both sides. Who Dominated the Ground Game? Jonathan Taylor was the undisputed king of the ground in this matchup. Carrying the ball 34 times, a new career high, Taylor amassed a total of 177 rushing yards and scored one touchdown. His average of 5.2 yards per carry showcased not just power, but consistency in grinding down the Jaguars’ defensive line. Tank Bigsby, while not putting up massive yardage, made his touches count. He rushed 14 times for 39 yards but found the end zone with one rushing touchdown and an opportunistic fumble recovery score. Rushing Leaders Player Carries Yards Average Touchdowns Jonathan Taylor 34 177 5.2 1 Tank Bigsby 14 39 2.8 1 (Rushing), 1 (Defensive) Taylor’s efforts not only moved the chains but helped Indianapolis control time of possession, which ended in their favour at 35:58. Colts vs Jacksonville Jaguars Match Player Stats The individual performances tell the real story behind this overtime battle. From offensive leaders to defensive stoppers, each player had a role to play. Offensive Leaders Joe Flacco (Colts): 264 YDS, 1 TD Mac Jones (Jaguars): 225 YDS, 1 TD, 1 INT Jonathan Taylor (Colts): 177 Rushing Yards, 1 TD Tank Bigsby (Jaguars): 39 Rushing Yards, 1 Rushing TD Brian Thomas Jr. (Jaguars): 103 Receiving Yards, 7 Receptions Josh Downs (Colts): 94 Receiving Yards, 10 Receptions Defensive Highlights Zaire Franklin (Colts): 1 Sack, 3 Solo Tackles Devin Lloyd (Jaguars): 1 Sack, 4 Solo Tackles Julian Blackmon (Colts): 1 Interception These stats reflect a balanced battle with standout contributions across both squads. Which Receivers Made the Biggest Impact? Brian Thomas Jr. was electric for Jacksonville. Pulling in 7 receptions for 103 yards, he was a constant threat downfield and played a crucial role in keeping drives alive. His speed and footwork made it difficult for defenders to keep up. Josh Downs was equally effective for the Colts. With 10 receptions for 94 yards, he acted as a reliable outlet for Joe Flacco, especially during crucial third downs. While Downs didn’t score, his consistent presence made a difference in sustaining drives. Both receivers demonstrated elite route-running and a high football IQ, turning short passes into significant gains and giving their teams vital offensive options. What Were the Defensive Standouts from Each Side? Defensively, both teams had key performers that influenced the flow of the game. For Indianapolis, Zaire Franklin was pivotal. He contributed a sack and three solo tackles, proving effective in both pass rush and run stopping. Julian Blackmon’s interception came at a crucial moment, stalling a promising Jaguars drive. His awareness and positioning disrupted Jacksonville’s momentum just as they were beginning to build confidence. On the Jaguars’ side, Devin Lloyd led the way. His sack and four solo tackles, along with a tackle for loss, made him a consistent disruption to the Colts’ offensive rhythm. Did Special Teams Make a Difference? Special teams are often overlooked until they become game-changers. In this matchup, both kickers were reliable, and their contributions were essential. Cam Little, the Jaguars’ kicker, nailed crucial field goals, including a 49-yarder late in the fourth quarter that briefly put Jacksonville ahead. His composure under pressure was notable. Matt Gay

How to Buy NBA League Pass UK? | Pricing and Subscription
If you’re a basketball fan living in the UK, you’ve probably found it challenging to catch every NBA game live without jumping through hoops. I remember missing key matches due to time zones or limited coverage. That’s when I discovered NBA League Pass UK, a game-changer for following the league from across the pond. Whether you’re a casual viewer or a hardcore fan, here’s how you can subscribe, what it costs, and what to expect. What Is NBA League Pass? For basketball fans across the UK, staying connected to the fast-paced world of the NBA has never been easier. NBA League Pass is the official streaming service offered by the National Basketball Association, designed to bring fans closer to the game, whether they’re watching on a phone during a commute or enjoying the match on a big screen at home. The service offers live and on-demand access to every game, in-depth analysis, alternative broadcasts, and customisation options like data overlays. With its expansive coverage and dedicated UK availability, NBA League Pass UK has become a must-have for anyone wanting to follow the league beyond highlight reels and match summaries. What Does NBA League Pass Offer UK Viewers? In the UK, NBA League Pass provides: Full live coverage of regular season games, Play-In Tournament, Playoffs, NBA Finals, and Summer League On-demand replays with various camera angles Multilingual commentary and multiple broadcast options 24/7 news, stats, and highlights With new features such as Multiview and offline downloads, it’s more than just a streaming service, it’s an all-access pass to the NBA universe. What Are the NBA League Pass UK Subscription Options? NBA League Pass UK offers flexible pricing for fans. Here’s a quick comparison of the main options: Plan Price (INR) Monthly Equivalent (Approx. GBP) Streams Commercials Offline Viewing League Pass (Season) ₹1499 ~£15 1 Included Not Included League Pass Premium (Season) ₹2099 ~£21 3 None Included Monthly League Pass ₹219/month ~£2.30 1 Included Not Included Monthly Premium ₹329/month ~£3.50 3 None Included Pricing in GBP may vary depending on exchange rates and platform used for purchase. What Is the Difference Between the Monthly and Season-Long NBA League Pass? Monthly Plans allow flexibility with a lower upfront cost and the ability to cancel anytime. Season Plans offer better value for fans who plan to follow the entire NBA season. Is There a Student Discount for NBA League Pass in the UK? Yes! Students in the UK can enjoy up to 40% off the standard subscription price. You’ll need to verify your student status via an authorised platform (such as UNiDAYS or Student Beans, depending on availability). What Do You Get with NBA League Pass Premium in the UK? Premium subscribers enjoy: Streaming on up to 3 devices No commercials, with uninterrupted in-arena content during breaks Offline downloads for later viewing Full access to Multiview and alternative camera angles Where Can You Watch NBA League Pass in the UK? You can watch NBA League Pass in the UK on a variety of devices: Smartphones: iOS and Android TVs: Apple TV, Android TV, Amazon Fire TV, Roku (select models) Gaming Consoles: PlayStation 4 & 5, Xbox One, Xbox Series X (select regions) Desktop: NBA.com (via browser) Streaming Devices: Chromecast, Fire Stick, Hisense smart TVs League Pass subscribers can link their NBA subscription to Prime Video and watch games directly through the platform, offering another layer of convenience. How Do You Access NBA League Pass Through the NBA App in the UK? Download the NBA App from the App Store or Google Play. After subscribing or linking your account, you can log in and start streaming games, checking scores, and downloading matches (Premium only). What Features Make NBA League Pass Unique for UK Fans? Multiview allows fans to stream up to 4 games simultaneously on a single screen, ideal for tracking multiple matchups or watching with friends who support different teams. Does NBA League Pass UK Offer Alternative Broadcasts and Languages? Yes, you can choose between: Home or away team broadcasts Mobile-optimised views Language options including Spanish, Korean, and Thai Special camera angles like player cam, sideline cam, and backboard cam Offline viewing is available only with Premium plans. You can download full games, recaps, and condensed versions to watch later on your iOS or Android device. Can You Cancel or Pause Your NBA League Pass UK Subscription? Monthly subscribers can cancel or pause at any time, with changes taking effect at the end of the billing cycle. Seasonal subscribers can cancel at the end of the term and opt out of auto-renewal. Season-long plans auto-renew before the new season begins, with a reminder email sent 30 days in advance. Is NBA League Pass UK Worth the Money? While some games may be available on Sky Sports or TNT Sports, NBA League Pass offers: Complete coverage No blackouts Greater interactivity Global content in real-time What Are the Pros and Cons of Getting NBA League Pass in the UK? Pros Comprehensive access to all games No blackouts Premium viewing experience Multilingual and alternate streams Cons Slight delay compared to cable broadcasts Some device compatibility limitations Exchange rate fluctuations may affect pricing How Can You Download NBA Games with League Pass in the UK? With the Premium plan, you can download: Full games Recaps Condensed highlights How Do You Access Your Downloaded Games on Mobile Devices? Navigate to: Game Details Page → ‘…’ menu → Download Or Profile → Preferences → Downloads Downloads are viewable anytime, even without an internet connection. What Are Some Alternatives to NBA League Pass UK? Team Pass allows you to follow a single team instead of the whole league, ideal for fans of specific franchises. Cost: ₹199/month (~£2). League Pass Commercial Plan supports 10+ devices, perfect for sports bars or commercial establishments. Conclusion For any basketball enthusiast living in the UK, NBA League Pass is the most complete and interactive way to stay connected to the league. Whether you’re a casual viewer or a die-hard fan, the options for streaming, pricing,
Huddersfield Junior Football League | Official Fixtures and Standings
When people talk about grassroots football in Yorkshire, the Huddersfield Junior Football League often comes to mind. For decades, it has been more than just a competition, it has been a community where young players learn, grow, and experience the joy of the game. Speaking with parents and coaches, one can feel the pride they hold in seeing children take their first steps into structured football. The energy at weekend matches, the sense of belonging among teams, and the opportunities for development all highlight the role this league plays in shaping the future of football in the region. The 2025–26 season is already underway, promising new rivalries, exciting fixtures, and inspiring stories from teams across multiple age groups. From the Under 7 Austria Division to the senior youth categories, Huddersfield Junior Football League brings together thousands of players, coaches, and families. This blog explores the fixtures, clubs, management, and overall significance of the league, offering readers an updated look at everything happening during the new season. What is Huddersfield Junior Football League? Huddersfield Junior Football League, commonly known as HJFL, is one of the largest and most respected youth football leagues in England. It is based in West Yorkshire and has been providing structured competitions for children and teenagers for over half a century. Entering its 50th season in 2025, the league continues to embody the spirit of grassroots football by encouraging participation for players of all abilities. The league covers multiple age groups ranging from Under 7s to Under 18s. In the current season, more than 1,120 teams are registered, creating one of the most inclusive football environments in the country. These teams represent communities across Huddersfield, Bradford, Leeds, and surrounding areas, ensuring that young players can enjoy the sport close to home. Key Features of the League Matches are arranged on weekends, giving children and families a routine opportunity to enjoy competitive football. The league promotes not only the competitive side of the game but also sportsmanship, teamwork, and respect. A dedicated committee oversees the smooth running of registrations, fixtures, referee appointments, and discipline. Huddersfield Junior Football League is affiliated with The FA, ensuring that its operations align with national football standards. This gives players opportunities to progress within the wider English football structure, including pathways into scholarships and academies. How Does the Huddersfield Junior Football League Season 2025–26 Work? The 2025–26 season is officially active, with fixtures already being played across different divisions. This season is inclusive of all age groups, covering divisions from the youngest Under 7 Austria to older age categories. Season Format Season Start: September 2025 Age Groups: Under 7 to Under 18 Divisions: Multiple, with U7 Austria being among the first to feature competitive fixtures this season Competition: League matches, occasional cups, and tournaments for different age categories The fixtures list is updated weekly on FA Full-Time and Huddersfield JFL platforms. Teams prepare rigorously, ensuring that players get the best balance of enjoyment and competitiveness. Sample U7 Austria Results – September 2025 Date Match Result 14/09/25 Bradford (Park Avenue) AFC Juniors U7 Gr vs Gildersome Spurs Juniors Blue X – X 14/09/25 Kirkburton Juniors U7 Corinthians vs Holmfirth Town FC Reds X – X 14/09/25 Lepton Highlanders JFC Blues vs Gomersal & Cleckheaton Argentina X – X 14/09/25 Littletown U7 Lions vs Golcar United Athletico X – X 14/09/25 Mount Pleasant Blues vs Brighouse Juniors Alpha X – X Upcoming Fixtures – September & October 2025 Date Fixture 21/09/25 Kirkburton Juniors U7 Corinthians vs Mount Pleasant Blues 21/09/25 Gildersome Spurs Juniors Blue vs Brighouse Juniors Alpha 21/09/25 Golcar United Athletico vs Bradford AFC Juniors U7 Gr 28/09/25 Littletown U7 Lions vs Holmfirth Town FC Reds 05/10/25 Holmfirth Town Reds vs Bradford AFC Juniors U7 Gr The fixtures demonstrate the excitement of early-season football, where teams are eager to set the tone for their year. Parents often fill the touchlines, cheering for their children and creating a unique community atmosphere. Which Age Groups and Divisions Take Part in the League? Huddersfield Junior Football League is designed to cater to young players of all ages. From the earliest footballing experiences at age seven to competitive fixtures for teenagers preparing for senior football, every stage of youth development is represented. Age Categories Under 7 – Under 11: Primarily non-competitive, focusing on development, enjoyment, and skill-building. Scores are recorded but the emphasis remains on participation. Under 12 – Under 14: Players begin to experience more structured competition. Points, tables, and results become more significant, allowing for a smoother transition into competitive football. Under 15 – Under 18: Highly competitive stages, preparing players for potential trials, scholarships, and even semi-professional opportunities. Divisions in 2025–26 The league contains multiple divisions under each age group. For example, the Under 7 Austria division is currently one of the highlighted competitions, with teams like Littletown Lions, Golcar United Athletico, Brighouse Juniors, and Holmfirth Town Reds competing regularly. Importance of Diverse Age Groups By covering all age categories, the league ensures: A continuous pathway from entry-level football to pre-adult competitions. Equal opportunities for boys and girls to participate in structured football. Development of technical and tactical awareness over time. Huddersfield Junior Football League’s approach ensures that players never feel out of place, regardless of whether they are beginners or aiming for academy-level football. Who Are the Clubs and Teams in Huddersfield Junior Football League? With over 1,120 teams registered for the 2025–26 season, Huddersfield Junior Football League is one of the largest grassroots football networks in England. Each club represents its community, offering young players the chance to enjoy the game close to home. Example of Registered Clubs for 2025–26 Club Name Age Categories Available AFC Lindley Juniors U7 – U18 Batley FC (Juniors) U7 – U16 Brighouse Juniors U7 – U18 Gildersome Spurs JFC U7 – U15 Kirkburton Juniors FC U7 – U18 Lepton Highlanders JFC U7 – U14 Holmfirth Town Juniors U7 – U18 Wyke Wanderers U7 – U18 These clubs not only provide football but also nurture values of
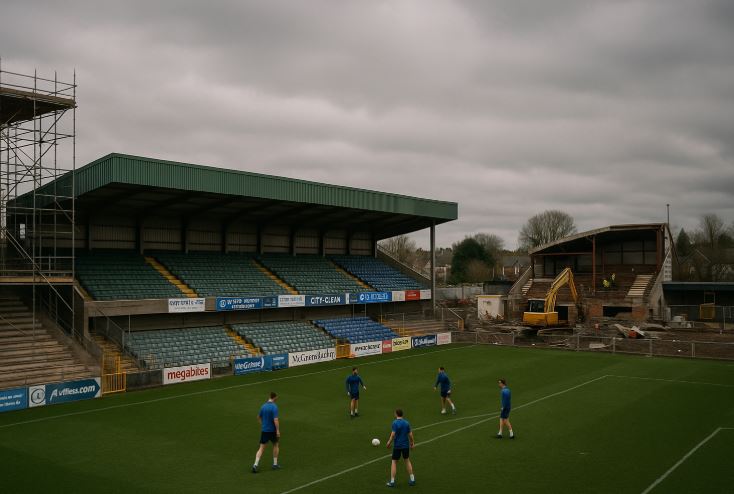
Northern Ireland Football Fund | Latest Updates & News
For many football clubs in Northern Ireland, 2025 was expected to be a turning point. After more than a decade of anticipation, discussions, and delays, the Northern Ireland Football Fund finally came to life. But while the headlines celebrated the long-awaited investment in domestic football infrastructure, the reality was far more complex. The recent funding announcement sparked excitement for some clubs and bitter disappointment for others. From Cliftonville and Glentoran’s multi-million-pound wins to Coleraine and Derry City’s surprise omissions, the response from the footballing community has been mixed. This blog dives deep into the Northern Ireland Football Fund, shedding light on its origins, structure, successful and unsuccessful applicants, and what it means for the future of football in Northern Ireland. What Is the Northern Ireland Football Fund? The Northern Ireland Football Fund is a major investment initiative launched by the Northern Ireland Executive, aimed at improving football facilities across the country. It focuses on enhancing the infrastructure for clubs competing at various levels, from elite professional teams to grassroots organisations. Background of the Fund Initially announced in 2011 under the name sub-regional stadia funding, the project was designed to complete a triad of sporting investments that previously benefited rugby and GAA. While Windsor Park and Ravenhill saw significant redevelopment through government support, domestic football clubs were left waiting. Years of political instability and budgetary constraints delayed the football-specific portion of the funding. It wasn’t until January 2025 that formal applications opened, and eligible clubs could finally bid for a share of the £36.2 million allocated. Purpose and Vision The fund aims to support clubs in: Redeveloping or building stadiums Enhancing community engagement Meeting safety and accessibility standards Providing better facilities for women’s and youth football It also has a long-term goal of establishing a National Football Centre at Galgorm, which will serve as a hub for player development and coaching excellence. Why Was the Northern Ireland Football Fund Created? The idea of the fund was born out of a pressing need. Football clubs across Northern Ireland have historically struggled with outdated infrastructure, limited resources, and unequal investment compared to other sports. Political and Sporting Context The absence of dedicated funding for domestic football became increasingly difficult to ignore as: Rugby and GAA facilities advanced significantly Club-level football suffered from declining infrastructure Costs for capital projects continued to rise When Casement Park was earmarked for redevelopment and Windsor Park completed its upgrades, football clubs asked: What about us? After public outcry and political lobbying, the NI Executive recognised the urgent need for a dedicated fund. But due to Stormont collapses and budget revisions, the fund was only finalised more than a decade later. Key Drivers Behind the Fund Community Benefit: Football remains the most participated sport in Northern Ireland. Improving stadiums means improving local engagement. Economic Growth: Updated venues can host events and boost local economies. Equality in Sport: The fund also includes support for the Women’s Premiership and League of Ireland club Derry City, acknowledging the broad impact of football. Who Are the Successful Clubs in the NI Football Fund? After a rigorous application process, 20 clubs were selected to move on to the next stage. These clubs were divided into three tiers based on their project value and funding requested. Tiered Breakdown of Successful Applicants Tier Funding Range Successful Clubs Tier 1 Less than £1.5 million Armagh City, Ballymacash Sports Academy, Lisburn Distillery, Queen’s University, Rathfriland Rangers Tier 2 £1.5 million to £6 million Ballinamallard United, Ballymena United, Banbridge Town, Bangor, Carrick Rangers, Dergview, Dungannon Swifts, Glenavon, Larne, Lisburn Rangers, Loughgall, Newry City, Oxford Sunnyside Tier 3 More than £6 million Cliftonville, Glentoran Cliftonville and Glentoran: The Big Winners These two clubs received approval to progress at the highest funding level. Each club applied for more than £6 million: Cliftonville plans to upgrade Solitude to meet modern standards Glentoran aims to redevelop the historic BetMcLean Oval Their success has been attributed to the quality and scale of their proposals, strong community impact plans, and long-standing contributions to NI football. How Is the NI Football Fund Structured Across Tiers? The fund was designed with a tiered approach to ensure fair and proportionate distribution of funds. This structure allowed clubs of varying sizes and resources to apply for funding appropriate to their project scope. Funding Tiers Explained Tier 1: Community-Level Projects Funding cap: £1.5 million Focused on smaller clubs or minor infrastructure upgrades Requires clubs to contribute at least 5% of total project cost Tier 2: Mid-Level Stadium Redevelopments Funding range: £1.5 to £6 million Medium-sized clubs aiming for more substantial developments Still required to co-finance projects Tier 3: Large-Scale Stadium Projects Minimum funding: £6 million Reserved for flagship redevelopment projects Includes strict evaluation of sustainability, feasibility, and community value Evaluation Criteria Applications were assessed on: Footballing need Community benefit Financial sustainability Project feasibility Projects with high impact and readiness received priority, but funding approval is not a guarantee of full financial disbursement. Each club must now pass the Due Diligence stage. Which Clubs Missed Out on the Football Fund – And Why? The exclusion of certain well-known clubs from the list of successful applicants came as a surprise to many fans and stakeholders. Notable Clubs That Missed Out Coleraine Derry City Institute Limavady United Crusaders Portadown Ards Linfield (did not apply) Despite their stature and development efforts, these clubs were not included in the initial list of 20. Their absence raised concerns about the geographic and political balance of the funding decisions. Reaction From Club Officials Ruairdhri Higgins, Coleraine manager and former Derry City boss, expressed frustration: “Geographically, for me, the north west has been shafted again.” Bill Anderson, chairman of Institute FC, added: “It’s hard to get your head around. I’m very disappointed and it will take a while to process.” Institute, in particular, had applied for £14 million to build a new stadium after losing their previous ground to flooding in 2017. What Has Been the Reaction to the Funding Results? The response from the footballing community